Thursday, June 30, 2011

A4 - Area Estimation for Images with Defined Edges

Was there a point in your life wherein you asked yourself how the government measures land area? How about scientists' way of estimating the size of cells?

Yes, one possible way is to do these tasks manually. However, manual calculation of areas/sizes often induce time conflicts.So the last resort is to create a program that will automatically do these tasks...

In this blog post, I will teach you how to estimate areas of shapes with defined edges using the technique derived from the Green's theorem.

Haha, I can hear you mumble and puzzled on how to use Green's theorem.

Strictly speaking, Green's theorem relates the line integral around a closed curve to a double integral over a region bounded by the closed curve with mathematical expression
Equation 1. Green's theorem 
where F1 and F2 are continuous functions.
In physics or mathematics, we often consider double integral as a representation of a region's area.

The summarized equations related are as follow:
  • We first consider a bounded region R.
Figure 1. Region R with a counterclockwise contour.
  • Choosing F1=0, F2=x, equation (1) becomes                                     
Equation 2.
  •  We next choose F1 to be -y and F2 to be 0, then equation (1) becomes

 Equation 3.

  • Then the area of region R is just the average of the right hand sides of equations (2) & (3).    

 
Equation 4.

  • Finally, if there are Nb pixels in the boundary, we can discretize equation (4) as

Equation 5.

Equation 5 will be the basic equation we will use in all parts of this post.
The next task is to implement equation (5) to obtain area estimations of shapes with defined edges and check the extent of its accuracy as compared to the theoretical areas of the shapes. The task will be easier if you create a black and white geometric shape such as a rectangle, a square, a circle, etc. If you need help on how to create these kind of black and white shapes, you can first read my blog post here.

In this post, I will show you the implementation of the technique on a square and a circle.

We first create circles of different radii along a 1000x1000 pixel area and save them in bmp format. The equivalent of this on a physical sense is a 2x2 sq. unit area. The radii I will use are 0.1, 0.2, 0.3, 0.4, 0.5, 0.6, 0.7, 0.8, 0.9 and 1.0 units.

Figure 2. Circles with increasing radii.


To obtain the x and y values we will use in equation (5), we implement a function in Scilab 4.1.2  follow(Img). This function returns two lists x and y which are points in the contour of the area concerned. The resulting plots using these x and y are

Figure 3. Contours of the circles in figure 2.

There are two ways of obtaining an estimation of the areas of the circles. 
First, we take the sum of the pixel values of the image using sum(I). This is plausible since the corresponding matrix of a binary image contain only values of 1 and 0. Thus, if we take the same sum of all the pixel values, we are in a way taking the total pixel values of a region where the area is our concern.
Second, we will use Green's theorem and the derived equation (5). 

A summarized version of the code is shown below

I = imread(image);  //opening an image
[x,y] = follow(I);   //parametric contour
scale_factor = 2/1000;   //scale conversion 1000x1000 pixel = 2x2 region
xi = x'*scale_factor;     //rescaling pixel value to physical value
yi = y'*scale_factor;    //rescaling pixel value to physical value
xi_1 = [xi(length(x)), xi(1:length(x)-1)];
yi_1 = [yi(length(y)), yi(1:length(y)-1)];
  
theoretical_area(i) = %pi * (radius^2);    //theoretical area
sum_area(i) = sum(I) * (scale_factor^2);    //area using the sum method
greens_area(i) = abs(0.5*sum(xi.*yi_1 - yi.*xi_1));    //area using the Green's method


The results and the corresponding percent errors are shown in table 1 and the plot of the errors for both the sum method and the Green's method is shown in figure 4.

Table 1. Results for circles of different radius on a 1000x1000 pixel area
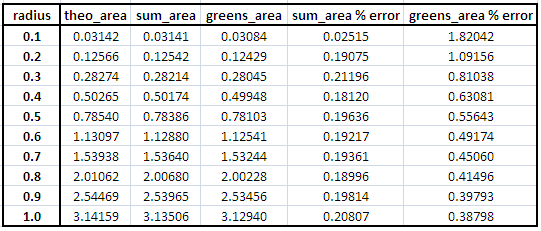
Figure 4. Plot of % errors of area estimation using sum and Green's theorem methods.

We can see that the sum method is more accurate than the Green's theorem method. We can also notice that as we increase the radius of the circle, the error decreases for the Green's theorem method while the sum method produces an almost non-changing error(except for r=0.1). The apparent error using Green's theorem method may be attributed to the fact that the pixels along the edge(contour) is not included in the area's computation. Also, the area of a circle contains an irrational number pi which is very difficult to approximate.

We must also take note that if we're talking about small numbers, small deviations or differences will result to large percent errors.

We apply the same method for squares of varying side lengths of 0.1, 0.2, 0.4, 0.6, 0.8, 1.0, 1.2, 1.4, 1.6 and 1.8. Results are shown below

Figure 5. Squares with increasing side length and has a 1000x1000 pixel area

Table 2. Results for squares of different side length 

 Figure 6. Plot of % errors of area estimation using sum and Green's theorem methods.

The same conclusions are achieved as that of circles. However, this time the sum method produced 0% error for any side length.
We emphasize that in the above method, I used an image of 1000x1000 pixel area. What if we decrease the pixel area size? Will there be a significant difference in the result? Since the main purpose of this activity is to investigate how well the Green's theorem method approximate areas. We probe this in the next part of this blog post. 

We follow the same method as above while changing the total pixel size area to 100x100, 200x200, 300x300, 400x400, 500x500, 600x600, 700x700, 800x800, 900x900 and 1000x1000. The resulting contour plots for both circle and square are
Figure 7. Contours of circles of varying pixel area size and constant radius = 0.5
Figure 8. Contours of squares of varying pixel area size and constant side length = 0.8

We then plot the %errors achieved by the Green's theorem method
Figure 9. Plot of % errors of area estimation of a circle using Green's theorem methods.
Figure 10. Plot of % errors of area estimation of a square using Green's theorem methods.

For both cases, we can safely conclude that as the resolution of the shape decreases, the error increases. This is due to the fact that for low resolution shapes, the contours are not continuous. You can actually verify this by enlarging(clicking) figures 7 and 8.


Now we know how to estimate areas of given shapes, we implement our technique in estimating the area of an actual location in the Philippines.

I particularly choose the University of Sto. Tomas, a very close university to my heart and my house. According here, the UST campus has a land area of 21.5 hectares or 2314240 sq. ft. or 215000 sq. m. The goal is to estimate the land area of UST using the methods above and compare it with the actual land area.
Figure 11. Map of UST obtained using Google map.

Using Gimp 2.0, I cropped figure 11 to a smaller pixel size area  and highlighted the area of interest.

                 
Figure 12. Cropped version of figure 11.    Figure 13. UST area is highlighted

We then convert figure 13 to a binary image and plot the contour of the edge of the region of interest.
 
Figure 14. Binary form of figure 13.
Figure 15. Contour of the region of interest.

If we apply both sum method and Green's theorem method, the resulting computed areas are 38547 sq. pixels and 38524 sq. pixels. However, these values are in pixel scale, so we have to find a relationship between pixels and actual physical units. The way to do this is to go back to figure 11. Google map provides us a scale of the map at the lower left portion. 

Figure 16.Actual scale.

So we count the number of pixels corresponding to 500ft. and 200m. The same method as in my previous blog post is used. I found out that 66 pixels = 500 ft and 87 pixels = 200 m. Using these conversion factors, we now observe the accuracy of our method.

Table 3. Results for the estimation of UST's land area.

We can see that approximately the error for the sum method is between 4% to 6%; and for the Green's theorem method, the error is approximately between 5% to 6%. This simply means that the method implemented above are good to some extent.


After 16 figures, 3 tables and 5 equations, I now conclude that this post is done! Hurrah!

Overall, I would give myself a grade of 10.0 for implementing the Green's theorem method in estimating areas of shapes with defined edges, for implementing another method of taking the sum of the pixel values of the binary images, for noting the accuracy of the methods for different parameters such as length of region and pixel area size, and for finding a way of using the given methods in estimating the area of a real world location.

 References:
[1] 'Area estimation of images with defined edges', 2010 Applied Physics 186 manual by Dr. Maricor Soriano
[2] http://www.symbianize.com/showthread.php?t=425263
[3] Google maps


Tuesday, June 28, 2011

A3 - Image Types and Formats

"A picture speaks a thousand words..." -anonymous
  
Above is one famous line indeed.
Picture serves as an outlet of reminiscing the past and rekindling memories and experiences. There is so much inside a picture considered priceless. However, even though pictures remain ubiquitous, only little is known about its physical properties by man. In this blog post, I will let you travel the inside realm of a picture by showing the physical quantities governing it.

Images come in different types depending on their properties. Basically, there are 8 types of images. Four of these are considered to be basic and four are results of advancing imaging techniques. The four basic types of images are binary, grayscale, truecolor, and indexed; while the four advanced types are high dynamic range (HDR), multi or hyperspectral, 3D and temporal images or videos.

In order to understand what distinguishes each image type from all others, I'll show you examples of each and a brief description.

BASIC IMAGE TYPES

A. Binary images 
-> A binary image is a digital image consisting of only black or white colors. In imaging sense, the only possible pixel values are either one or zero. Binary images are commonly used in fingerprints and fax machines because of the small file size(~8KB for a 256x256 pixel image).  An example is shown below with some of its properties written on its right. The properties can be displayed in Scilab 4.1.2 SIP toolbox using imfinfo(filename, 'verbose'), while for higher Scilab version(SIVP toolbox) imfinfo(filename) will suffice. The properties shown are
 FileSize: measured in bytes 
Format: "JPEG", "TIFF", "GIF", "BMP", etc. 
Width: number of columns 
Height: number of rows 
Depth: bits per pixel 
StorageType: "truecolor" or "indexed" 
NumberOfColors: size of the colormap. Equals to zero for truecolor images 
ResolutionUnit: "inch" or "centimeters" 
XResolution: number of pixels per ResolutionUnit in X direction 
YResolution: number of pixels per ResolutionUnit in Y direction 


        FileSize: 41346
         Format: PNG
          Width: 256
         Height: 256
          Depth: 8
    StorageType: truecolor
 NumberOfColors: 0
 ResolutionUnit: centimeter
    XResolution: 72.000000
    YResolution: 72.000000

Figure 1: Binary image of a fingerprint
(http://www.csse.uwa.edu.au/~pk/research/matlabfns/FingerPrints/Docs/index.html)

B. Grayscale Images
->A grayscale image consists of colors from the shade of gray. To be exact, the pixel values ranges only from 0 to 255. Grayscale images need less information to be provided for each pixel since the intensities of red, green and blue(RGB) are equal that only one intensity value is used. Most commonly, biological and medical images use grayscale.

       FileSize: 2767
         Format: JPEG
          Width: 220
         Height: 229
          Depth: 8
    StorageType: truecolor
 NumberOfColors: 0
 ResolutionUnit: centimeter
    XResolution: 72.000000
    YResolution: 72.000000

Figure 2: Grayscale image of a Gecko's xray
(http://www.flickr.com/photos/milclayton/5098858362/)

C. Truecolor Images
->A truecolor image is a digital image that depicts the real object as perceived by a person in real world. It is the combination of three channels which are the intensity of red, green and blue colors. Truecolor images are the most common type because of the creation and wide distribution of commercial digital cameras.

       FileSize: 286048
         Format: JPEG
          Width: 1280
         Height: 851
          Depth: 8
    StorageType: truecolor
 NumberOfColors: 0
 ResolutionUnit: inch
    XResolution: 72.000000
    YResolution: 72.000000


Figure 3. Truecolor image of our 2011 vacation in Laguna.
(Photo taken by Mr. Arvie D. Ubarro)

D. Indexed Images
->An indexed image consists of colors represented by a colormap. Aside from saving the pixel matrix values of an image, colormap values must also be stored. Indexed images are comparable to truecolor images but with reduced information.

       FileSize: 12246
         Format: JPEG
          Width: 288
         Height: 288
          Depth: 8
    StorageType: truecolor
 NumberOfColors: 0
 ResolutionUnit: inch
    XResolution: 72.000000
    YResolution: 72.000000

Figure 4. Indexed image.
(http://printplanet.com/forums/enfocus/16504-indexed-color-spaces)

ADVANCED IMAGE TYPES
A. High Dynamic Range Images
-> Can be stored in 10- to 16-bit grayscales and are often used in very bright scenes(e.g. sun images).

       FileSize: 88904
         Format: JPEG
          Width: 600
         Height: 381
          Depth: 8
    StorageType: truecolor
 NumberOfColors: 0
 ResolutionUnit: centimeter
    XResolution: 100.000000
    YResolution: 100.000000

Figure 5. HDR image of a rally racing car.
(http://www.designsdelight.com/hdr-photography/hdr-2/?replytocom=1359)

B. Multi or hyperspectral Images
-> Uses more than 3 color bands. A multispectral image uses bands in the order of 10's while a hyperspectral  uses order of 100's. This is the most common image type used in satellite images.

       FileSize: 261424
         Format: GIF
          Width: 523
         Height: 525
          Depth: 8
    StorageType: indexed
 NumberOfColors: 256
 ResolutionUnit: centimeter
    XResolution: 72.000000
    YResolution: 72.000000

Figure 6. Multi or hyperspectral image.
(http://www.fs.fed.us/r5/rsl/projects/remote-sensing/mss.shtml)

C. 3D Images
->As the name imples, this is a 3-dimensional image where its information are stored spatially. 3D images can be taken by taking multiple images of an object a short distance apart and superimposing them.

    
   FileSize: 326560
         Format: JPEG
          Width: 800
         Height: 601
          Depth: 8
    StorageType: truecolor
 NumberOfColors: 0
 ResolutionUnit: inch
    XResolution: 96.000000
    YResolution: 96.000000


Figure 7. 3D image of a tiger.
(http://www.maximumpc.com/article/features/future_tense_3d_or_not_3d)

D. Temporal Images or Videos
-> This is basically a moving picture. Its presence became very prominent in recent times due to the invention of camera with high frame rates.

 Video 1: Temporal Video of a popping water balloon.
(http://www.youtube.com/watch?v=_HNve7bekeM)

Since we now know the different types of images, we try converting one type to another type using Scilab functions. We will implement these conversions on a truecolor image shown below
Figure 8. Truecolor image.
(Photo taken by Mr. Arvie D. Ubarro)

We can convert a truecolor image to a binary image by just using the lines 
I  = imread(filename); // Opening the image in Scilab 4.1.2 using its filename
BW = im2bw(I, level); //Converts the image I into binary by following a threshold value, level.

In Scilab, the possible threshold (level) values are between 0 to 1. It works by mapping the pixel values greater than or equal to this threshold to 1 and values less than the threshold are mapped to 0. The resulting binary image when I used a 0.5 threshold is shown below.

Figure 9. Binary image using a 0.5 threshold.

We then convert the same truecolor iamge to a grayscale image. In Scilab 4.1.2, there are two ways of doing this, useful coding lines are shown below
I  = imread(filename); // Opening the image using its filename 
GR = im2gray(I); //Converts the image I into grayscale
OR
GR = gray_imread(filename); //Converts the RGB image from the path filename into grayscale

The resulting grayscale image is shown below

Figure 10. Grayscale version of figure 8.

For both cases, the following changes in properties are observed:
  • The storage type was converted from a Truecolor image to an Indexed Image.
  • The matrix size changed from 851x2580x3 pixels into 851x2580 pixels. This is to show that converting a truecolor image to grayscale or binary flattens the image signifying that the 3channels related to RGB colors become one. The size of an image can be seen using size(matrix).
Using the techniques learned, the next goal is to separating a background from a region of interest. This can be done by following this procedure and available code:
  • Open first an image using imread(filename)
Figure 11.  Hand-drawn graph from activity 1.

  •  Convert the opened image to grayscale using the two methods introduced above. Either im2gray(image) or gray_imread(filename). This will enable us to limit the pixel values to 0 until 255 and separation will be easier.
Figure 12. Grayscale version of figure 11.
  • Obtain a histogram of the grayscale image using histplot(number of bins, image). In particular, I used 256 bins to create a separate bin for each grayscale value from 0 to 255. So what is a histogram then? A histogram of a grayscale image represents the number of pixels(y-axis) having a certain grayscale value(x-axis). The histogram can be very useful in separating lines from a background because it suggests the most suitable threshold to be used.
Figure 13. Histogram of figure 12.
  • From the histogram, we can see that the possible good threshold values are between 150/255 (0.588) and 170/255 (0.667). We used these threshold values in BW = im2bw(image, threshold) and compare the results.


          Figure 14. 0.667 threshold.                     Figure 15. 0.647 threshold.


          Figure 16. 0.627 threshold.                    Figure 17. 0.588 threshold.

By comparing results of figures 14-17, we can say that the best threshold value is 0.667 because the lines are clearly seen and the information is complete. A very simple procedure indeed. However, a possible problem you might encounter while opening the scanned image is
Do not panic when you reach that point. The problem is mainly a stacksize error or that the memory available for Scilab to use exceeds the memory needed in your program. This can be easily remedied by increasing the stacksize using stacksize(n) where n is the size you want.

Have you heard of the image file formats jpg, bmp or png? I believe yes is your answer. The million dollar question is do you know the differences between them and what distinguishes one from another? Does saving to particular file format matters? These questions can be briefly answered below.

There are actually many image file formats and the most common of them are the JPG, BMP, PNG, GIF, and TIFF. The main difference between them are in their color depth and compression.

Color depth is the number of bits needed to represent the color of a single pixel. 

Compression, on the other hand, is the reduction of irrelevant and redundant image data. There are two types of image compression:
  1. Lossy : storage of color information at a less resolution than the image itself. This results to a smaller compact file.
  2. Lossless : efficient storage of color information without compromising accuracy because every pixel information is preserved.

IMAGE FILE FORMATS
A. Joing Photographic Experts Group (JPG)
-> Commonly used in photographs containing many colors. It stores 24 bit or 16 million color information. However, the drawback is that each time the image is edited and saved, image fidelity reduces because of its lossy compression.

B. Bitmap (BMP)
-> Handles graphic files in the Microsoft Operating System. BMP files are commonly large due to its uncompressed quality.

C. Portable Network Graphics (PNG)
-> The open source version of GIF and is stored using 16 million colors. It is designed to be used in online web applications because of its robustness to integrity and transmission error checking. Its format compression is lossless

D. Graphics Interchange Format (GIF)
-> Commonly used in simple diagrams and shapes because it only stores 8 bit or 256 colors. This image format is considered to be the most suitable for storing animation effects. However, it is not advisable to use this for detailed images because of its lossless compression.

E. Tagged Image File Format (TIFF)
-> Ideal for editing large prints because of its retention of large image information. It can store variable number of bits and the compression can be lossy or lossless.

Now we know the different image file formats, some considerations must  be made before saving an image to obtain efficiency.

Phew! This is one long activity indeed. The activity is tiring yet informative. It is only after finishing the activity that I fully understand the wonderful world of images. As a conclusion, I will give myself a grade of 10.0 for satisfactorily completing the entire activity and producing results needed.

References:
  1. http://en.wikipedia.org/wiki/Image_file_formats
  2. http://www.wfu.edu/~matthews/misc/graphics/formats/formats.html
  3. "Image Types and Formats", 2010 Applied Physics 186 manual by Dr. Maricor Soriano

Tuesday, June 21, 2011

A2 - Scilab Basics

Solving real world problems is a very complex task. The observable and non-observable interactions between components influence the over-all characteristic of a certain real world phenomena. However, the complicated tasks can be partially solved by computer programming. Programming as a scientific tool is very useful in recreating the physical world by implementing rules and variables which can somewhat simulate the present governing rules. In relation to this, our task is to familiarize ourselves with Scilab, powerful scientific programming language which is a free counterpart of Matlab.

The first thing to do is install Scilab and an image processing toolbox called SIP. However, for current versions of Scilab, SIVP (Signal, Image and Video Processing) Toolbox will be more compatible.

For beginners, Scilab can be learned by just reading its documentation and tutorials at Scilab Tutorial and practicing code creation.

In order to test the depth of our understanding in using Scilab, an exercise on creating patterns is followed. These patterns can be used in masking and as apertures in optical systems. 

The first thing to do is to used the code given by Dr. Soriano to create a centered circle which can simulate a circular aperture or pinhole. The resulting image is shown below(figure 1) and the code to produce it follows after.

 
Figure 1.  Centered circle/circular aperture.

Code for a Circular Aperture:

nx = 500; ny = 500;   //defines the number of elements along x and y
x = linspace(-1,1,nx);   //defines the range
y = linspace(-1,1,ny);
[X,Y] = ndgrid(x,y);   //creates two 2-D arrays of x and y coordinates
r = sqrt(X.^2 + Y.^2);   //note element-per-elementsquaring of X and Y
A = zeros(nx,ny);   //creating a matrix of zeros
A(find(r<0.7)) = 1;  //replacing the zeros by 1 when the condition r<0.7 is satisfied
//imshow(A, []);   //showing the image produced
imwrite(A,'centered_circle_500.png');   //saving the image

The next task is to create codes to produce synthetic images described as a centered square aperture, sinusoid along the x-direction(corrugated roof), grating along the x-direction, annulus and a circular aperture with graded transparency(a gaussian transparency to be exact).

A. Centered Square Aperture 
A centered square aperture can be created as simple as creating a centered circle(figure 1) but instead of implementing a condition to replace the zeros of A by one for a radius r, a condition is changed to -0.7<X<0.7 and -0.7<Y<0.7. The resulting image is in figure 2 and the corresponding code follows.

Figure 2.  Centered square/rectangular aperture.

Code for a Rectangular Aperture:

nx = 500; ny = 500;   //defines the number of elements along x and y
x = linspace(-1,1,nx);   //defines the range
y = linspace(-1,1,ny);
[X,Y] = ndgrid(x,y);   //creates two 2-D arrays of x and y coordinates

A = zeros(nx,ny);   //creating a matrix of zeros
A(find(X<0.7 & X>-0.7 & Y<0.7 & Y>-0.7)) = 1;  //replacing the zeros by 1 when the condition is satisfied
//imshow(A, []);   //showing the image produced
imwrite(A,'centered_square_aperture_500.png');   //saving the image


B. Sinusoid along the x-direction(corrugated roof) 
In a corrugated roof, the only thing to do is to operate a sine function to the X points. The resulting image is shown in figure 3 while the code follows.

Figure 3.  Sinusoid along the x-direction(corrugated roof).

Code for a Corrugated Roof:

nx = 500; ny = 500;   //defines the number of elements along x and y
x = linspace(-1,1,nx);   //defines the range
y = linspace(-1,1,ny);
[X,Y] = ndgrid(x,y);   //creates two 2-D arrays of x and y coordinates

A = sin(6 * %pi * X);;  //operating a sine function on X
//imshow(A, []);   //showing the image produced
imwrite(A,'corrugated_roof_500.png');   //saving the image


C. Grating along the x-direction 
To create a grating along the x-direction, it is as if creating a rectangular aperture but varying the locations of the ones. Here, I divided a 500x500 pixel area into ten rectangular strips, 5 of which have a value of 1 and 5 have a value of 0.
Figure 4.  Grating along the x-direction.

Code for a Grating:

nx = 500; ny = 500;   //defines the number of elements along x and y
x = linspace(-1,1,nx);   //defines the range
y = linspace(-1,1,ny);
[X,Y] = ndgrid(x,y);   //creates two 2-D arrays of x and y coordinates

A = zeros(nx,ny);   //creating a matrix of zeros   
for i = 0:4
  A((1 + 100*i):(nx/10 + 100*i), 1:ny) = 1;   //
replacing the zeros by 1 when the condition is satisfied
end
//imshow(A, []);   //showing the image produced
imwrite(A,'grating_500.png')   //saving the image

  
D. Annulus 
An annulus is the same as a circular aperture, the only difference is that the condition that r<0.7 is changed to 0.4<r<0.7.
Figure 5.  Annulus.


Code for an Annulus:

nx = 500; ny = 500;   //defines the number of elements along x and y
x = linspace(-1,1,nx);   //defines the range
y = linspace(-1,1,ny);
[X,Y] = ndgrid(x,y);   //creates two 2-D arrays of x and y coordinates
r = sqrt(X.^2 + Y.^2);   //note element-per-elementsquaring of X and Y
A = zeros(nx,ny);   //creating a matrix of zeros
A(find(r<0.7 & r>0.4)) = 1;  //replacing the zeros by 1 when the condition 0.4<r<0.7 is satisfied
//imshow(A, []);   //showing the image produced
imwrite(A,'annulus_500.png');   //saving the image


E. Circular Aperture with Graded Transparency(gaussian transparency) 
In this part, the same technique used to create a circular aperture is used. However, this time, instead of replacing the zeros with ones for certain radius r, a gaussian function of the form exp(-r^2) is used where I consider the standard deviation b, as 1 in the original gaussian distribution of exp(-x^2/2*b^2).
 
Figure 6. Circular aperture with gaussian transparency.

Code for a Circular Aperture with Gaussian Transparency:

nx = 500; ny = 500;   //defines the number of elements along x and y
x = linspace(-1,1,nx);   //defines the range
y = linspace(-1,1,ny);
[X,Y] = ndgrid(x,y);   //creates two 2-D arrays of x and y coordinates
r = sqrt(X.^2 + Y.^2);   //note element-per-elementsquaring of X and Y
A = exp(-10*r.^2);   //operating a gaussian function
//imshow(A, []);   //showing the image produced
imwrite(A,'gaussian_transparency_500.png');   //saving the image


I then created two more images which are often used in real world optical systems, the double slit(figure 7) and a cross slit(figure8).

Figure 7. Double Slit

Figure 8. Cross Slit.

Code for a Double Slit:

nx = 500; ny = 500;   //defines the number of elements along x and y
x = linspace(-1,1,nx);   //defines the range
y = linspace(-1,1,ny);
[X,Y] = ndgrid(x,y);   //creates two 2-D arrays of x and y coordinates

A = zeros(nx,ny);   //creating a matrix of zeros
A(find(Y<-0.1 & Y>-0.2 & X<0.8 & X>-0.8)) = 1;   //replacing the zeros by 1 when the condition is satisfied

A(find(Y<0.2 & Y>0.1 & X<0.8 & X>-0.8)) = 1;
//imshow(A, []);   //showing the image produced
imwrite(A,'double_slit_500.png');   //saving the image


Code for a Cross Slit:

nx = 500; ny = 500;   //defines the number of elements along x and y
x = linspace(-1,1,nx);   //defines the range
y = linspace(-1,1,ny);
[X,Y] = ndgrid(x,y);   //creates two 2-D arrays of x and y coordinates

A = zeros(nx,ny);   //creating a matrix of zeros
A(find(Y<0.1 & Y>-0.1 & X<0.8 & X>-0.8)) = 1;   //replacing the zeros by 1 when the condition is satisfied

A(find(X<0.1 & X>-0.1 & Y<0.8 & Y>-0.8)) = 1;
//imshow(A, []);   //showing the image produced
imwrite(A,'cross_500.png');   //saving the image


In summary, the goals of this activity are to:
  1. Familiarize ourselves with Scilab.
  2. Create codes that can simulate apertures in optical systems using Scilab.
Based on the goals shown above, I would give myself a score of 12. 10 for being able to do the activity alone and creating images which can serve as optical tools in optical systems using the power of Scilab; and a bonus of 2 for taking the initiative of creating additional images for other kinds of apertures.